Monitoring and Metrics
Dato Predictive Services provides a set of interfaces to gain insight into a running Predictive Services deployment, both visually as well as APIs.
Predictive Service Dashboard in GraphLab Canvas
To visualize a deployment using GraphLab Canvas, simply run show, as follows:
deployment.show()
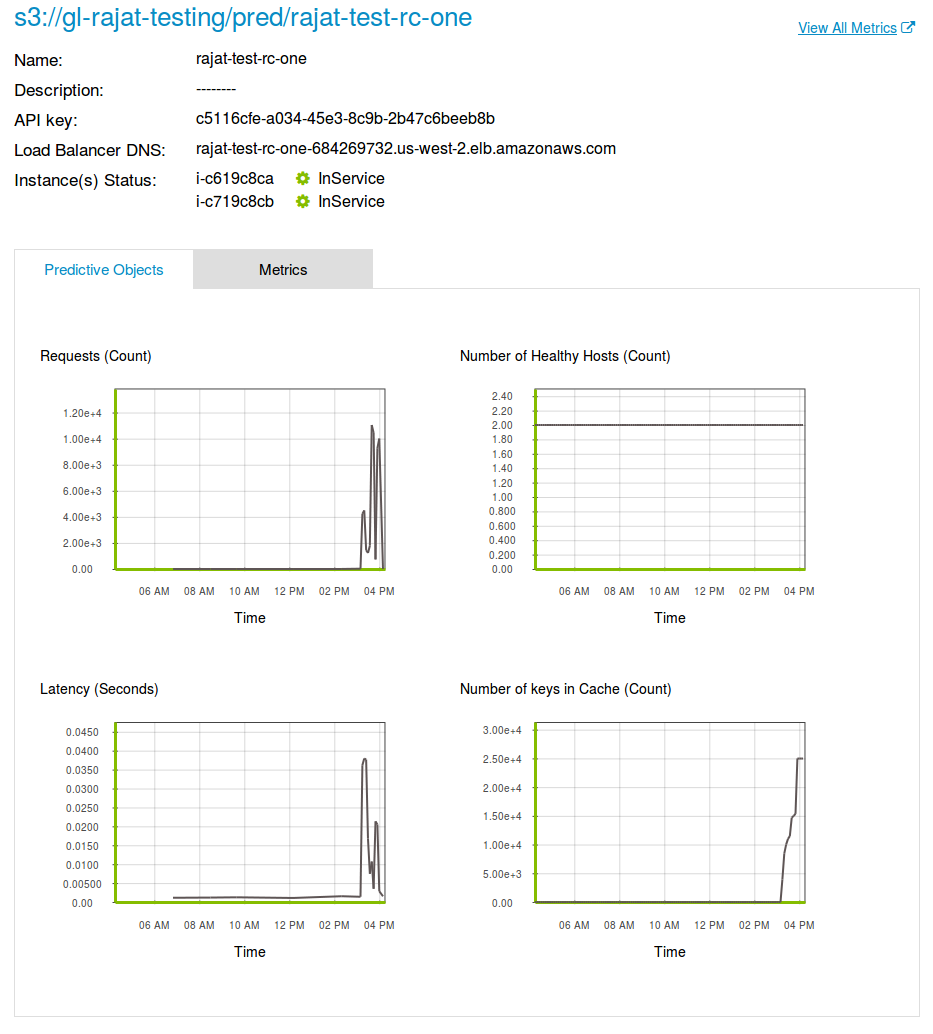
This will launch GraphLab Canvas in your browser and show you a dashboard for this Predictive Service, like the example above.
If you would like to see an overall dashboard of all your Predictive Services, run:
graphlab.deploy.predictive_services.show()
Using the Predictive Service dashboard you can see the important metrics about the deployment for the last six hours.
View Deployment Metrics in CloudWatch
To zoom in beyond the basic dashboard, you can click through to Amazon CloudWatch, where the metrics for a Predictive Service are stored. Using the dashboard offered there you can see the individual metrics for a Predictive Object, or overall metrics about the deployment.
Setting Alarms using CloudWatch Alarms
To set alarms for a deployment, use the Amazon CloudWatch console for the metrics published by the Predictive Service Deployment.
For more information see the Amazon CloudWatch Alarms documentation.
Monitoring APIs
To retrieve the overall status of a deployment, call get_status.
print deployment.get_status()
You may get status of different aspects of the deployment by way of the view parameter to get_status
# get node status
deployment.get_status(view='node')
Columns:
    cache    str
    dns_name    str
    instance_id    str
    state    str

Rows: 1

Data:
+---------+-------------------------------+-------------+-----------+
|  cache  |            dns_name           | instance_id |   state   |
+---------+-------------------------------+-------------+-----------+
| Healthy | ec2-52-24-53-250.us-west-2... |  i-8af8867c | InService |
+---------+-------------------------------+-------------+-----------+
[1 rows x 4 columns]
Or alternatively,
# get cache status
deployment.get_status(view='cache')

# get Predictive Object status
deployment.get_status(view='model')
This API returns an SFrame regarding each Predictive Object's status on each node in the deployment, so it is easy to verify programmatically when a Predictive Object has been fully loaded by all nodes in the deployment.
Service Metrics
Through the get_metrics API a variety of operational metrics about the predictive service can be retrieved. By default, the method returns the number of requests and the average latency over the last 12 hours, in 5 minute increments:
ps.get_metrics()
{'requests':
+------------------+---------------------------+-------------------+
|       sum        |            time           |        unit       |
+------------------+---------------------------+-------------------+
|       8.0        | 2014-11-13 00:31:00+00:00 |       Count       |
|       2.0        | 2014-11-13 00:36:00+00:00 |       Count       |
|       7.0        | 2014-11-13 00:41:00+00:00 |       Count       |
|     24707.0      | 2014-11-13 00:46:00+00:00 |       Count       |
|       5.0        | 2014-11-13 00:51:00+00:00 |       Count       |
......
'latency':
+------------------+---------------------------+-------------------+
|     average      |            time           |        unit       |
+------------------+---------------------------+-------------------+
|    0.0229513     | 2014-11-13 00:31:00+00:00 |      Seconds      |
|    0.0231056     | 2014-11-13 00:36:00+00:00 |      Seconds      |
|    0.0221893     | 2014-11-13 00:41:00+00:00 |      Seconds      |
|    0.0578591     | 2014-11-13 00:46:00+00:00 |      Seconds      |
|    0.0225744     | 2014-11-13 00:51:00+00:00 |      Seconds      |
......
Aside from requests and latency, the number of exceptions as well as cache-specific counters can be retrieved. Moreover, the scope can be reduced to a specific endpoint. For more information see the API documentation of get_metrics.