Creating an SGraph
For the following SGraph exercises, we'll use the countries and results from two groups in the 2014 World Cup to explore SGraph construction, summarization, visualization, and filtering. To model this kind of data as a graph, we'll represent countries by vertices and game outcomes by directed edges. The source vertex for each edge is the losing team, and the destination vertex is the winning team. Ties are represented by including edges in both directions.
The following data was transcribed from the FIFA website.
countries = {
    'usa': 'G',
    'ghana': 'G',
    'germany': 'G',
    'portugal': 'G',
    'england': 'D',
    'italy': 'D',
    'costa rica': 'D',
    'uruguay': 'D'}

results = [
    ('portugal', 'germany'),
    ('ghana', 'usa'),
    ('portugal', 'usa'),
    ('usa', 'portugal'),
    ('usa', 'germany'),
    ('ghana', 'portugal'),
    ('ghana', 'germany'),
    ('germany', 'ghana'),
    ('england', 'italy'),
    ('england', 'uruguay'),
    ('england', 'costa rica'),
    ('costa rica', 'england'),
    ('uruguay', 'costa rica'),
    ('italy', 'costa rica'),
    ('italy', 'uruguay')]
Question 1:
Construct SFrames for the vertex and edge data.
verts = graphlab.SFrame({'name': countries.keys(),
                         'group': countries.values()})
print verts
+-------+------------+
| group |    name    |
+-------+------------+
|   G   |   ghana    |
|   G   |  germany   |
|   G   |  portugal  |
|   G   |    usa     |
|   D   |  uruguay   |
|   D   |  england   |
|   D   |   italy    |
|   D   | costa rica |
+-------+------------+
[8 rows x 2 columns]
losers, winners = zip(*results)
edges = graphlab.SFrame({'loser': list(losers),
                   'winner': list(winners)})
print edges
+----------+----------+
|  loser   |  winner  |
+----------+----------+
| portugal | germany  |
|  ghana   |   usa    |
| portugal |   usa    |
|   usa    | portugal |
|   usa    | germany  |
|  ghana   | portugal |
|  ghana   | germany  |
| germany  |  ghana   |
| england  |  italy   |
| england  | uruguay  |
|   ...    |   ...    |
+----------+----------+
[15 rows x 2 columns]
Question 2: Make an empty SGraph.
sg = graphlab.SGraph()
Question 3: Add the vertices and edges to the graph.
sg = sg.add_vertices(verts, vid_field='name')
sg = sg.add_edges(edges, src_field='loser', dst_field='winner')
Summarize and visualize the graph
Question 4: Summarize the graph. How many vertices and eges are there?
The summary method gives the number of vertices and edges in the graph, which is often the best place to start.
print sg.summary()
{'num_edges': 15, 'num_vertices': 8}
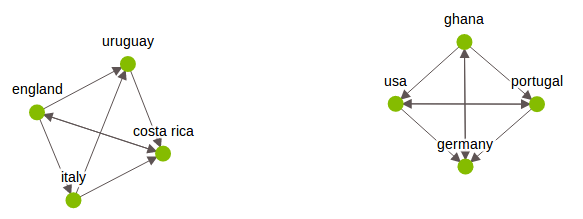
Question 5: Show the graph. Highlight the teams from North America, and use arrows to indicate the winner of each match.
sg.show(arrows=True, vlabel='id')
Question 6: Extract the vertices and edges as SFrames. Do the numbers of rows and edges match the summary?
The graph's SFrames for vertices and edges show there are indeed 8 vertices (with a 'group' attribute) and 15 edges (with no attributes).
sf_vert = sg.vertices
print sf_vert
+------------+-------+
|    __id    | group |
+------------+-------+
|   ghana    |   G   |
| costa rica |   D   |
|  portugal  |   G   |
|    usa     |   G   |
|  england   |   D   |
|  germany   |   G   |
|   italy    |   D   |
|  uruguay   |   D   |
+------------+-------+
[8 rows x 2 columns]
sf_edge = sg.edges
print sf_edge
+------------+------------+
|  __src_id  |  __dst_id  |
+------------+------------+
|   ghana    |  portugal  |
|   ghana    |    usa     |
|   ghana    |  germany   |
| costa rica |  england   |
|  portugal  |    usa     |
|  portugal  |  germany   |
|    usa     |  portugal  |
|    usa     |  germany   |
|  germany   |   ghana    |
|  england   | costa rica |
|    ...     |    ...     |
+------------+------------+
[15 rows x 2 columns]
Filter the vertices
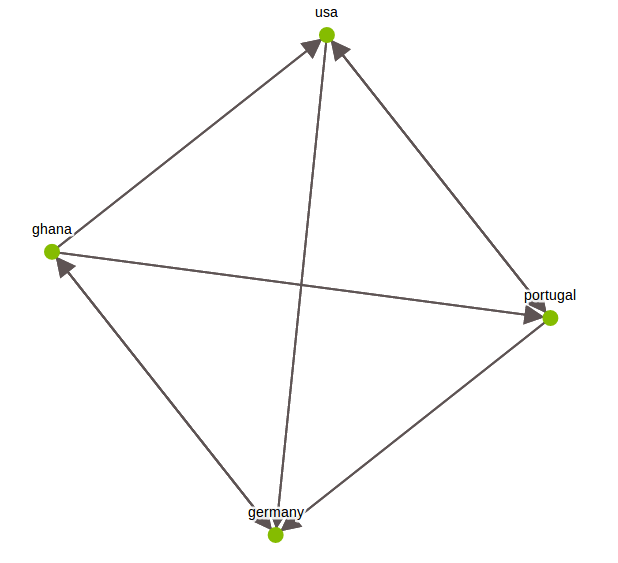
Question 7: Extract only the vertices in group H and plot the subgraph.
There are a couple ways to do this. The get_vertices command is the most straightforward, but filtering on the underlying SFrame is more flexible.
sub_verts = sg.vertices[sg.vertices['group'] == 'G']  # option 1
sub_verts = sg.get_vertices(fields={'group': 'G'})  # option 2
print sub_verts
+----------+-------+
|   __id   | group |
+----------+-------+
|  ghana   |   G   |
| portugal |   G   |
|   usa    |   G   |
| germany  |   G   |
+----------+-------+
[4 rows x 2 columns]
To materialize the subgraph, construct a new SGraph and add the edges of subgraph.
subgraph = graphlab.SGraph()
subgraph = subgraph.add_edges(sg.get_edges(src_ids=sub_verts['__id']))
print subgraph.summary()
{'num_edges': 8, 'num_vertices': 4}
subgraph.show(vlabel='id', arrows=True, ewidth=2)
Compute vertex degree
The in-degree of a vertex is the number of edges that point to the vertex, the out-degree is the number of edges that point out from the vertex, and the degree is the sum of these two. In the context of our World Cup example, the in-degree is the number of wins and ties, and the degree is the total number of games for a given team. In this set of exercises, we'll use triple apply to compute the in-degree of each vertex. For more on vertex degree, check out the Wikipedia article.
Question 8: Define a function to increment the degree counts for an arbitrary source-edge-destination triple. This function should simply add 1 to the degree field for each of the source and destination vertices.
def increment_in_degree(src, edge, dst):
    dst['in_degree'] += 1
    return (src, edge, dst)
Question 9: Create a new vertex field with in-degree set to 0 for each vertex.
Add the 'degree' field to the vertex attributes. Note that adding vertices with the same id's to the graph does not cause duplicate entries.
sf_vert['in_degree'] = 0
sg = sg.add_vertices(sf_vert)
Question 10: Use the triple apply function to compute in-degree for all nodes. Which team(s) did the best in the group stage?
sg = sg.triple_apply(increment_in_degree, mutated_fields=['in_degree'])
print sg.vertices.sort('in_degree', ascending=False)
+------------+-------+-----------+
|    __id    | group | in_degree |
+------------+-------+-----------+
| costa rica |   D   |     3     |
|  germany   |   G   |     3     |
|  portugal  |   G   |     2     |
|    usa     |   G   |     2     |
|  uruguay   |   D   |     2     |
|   ghana    |   G   |     1     |
|  england   |   D   |     1     |
|   italy    |   D   |     1     |
+------------+-------+-----------+
[8 rows x 3 columns]
Costa Rica and Germany did the best of these two groups in the group stage. If this is surprising, don't forget that we counted tie games twice.